IV. Security operation
Sources of this notes
Summary: AZ-500 Microsoft Azure Security Engineer Certification
Cheatsheets: Azure-CLI | Azure PowerShell
100 questions you should pass for the AZ-500 certificate
1. Configure and manage Azure Monitor
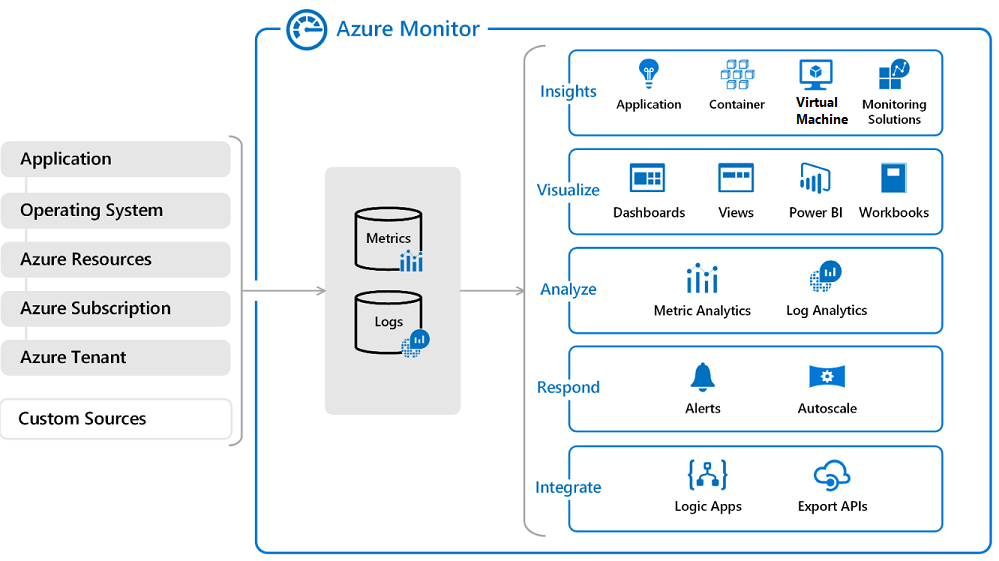
1.1. Exploring Azure Monitor
Exporting data to a SIEM
Azure Monitor offers a consolidated pipeline for routing any of your monitoring data into a SIEM tool. This is done by streaming that data to an event hub, where it can then be pulled into a partner tool. This pipe uses the Azure Monitor single pipeline for getting access to the monitoring data from your Azure environment. Currently, the exposed security data from Microsoft Defender for Cloud to a SIEM consists of security alerts.
Microsoft Defender for Cloud security alerts Microsoft Defender for Cloud automatically collects, analyzes, and integrates log data from your Azure resources; the network; and connected partner solutions.
Azure Event Hubs Azure Event Hubs is a streaming platform and event ingestion service that can transform and store data by using any real-time analytics provider or batching/storage adapters. Use Event Hubs to stream log data from Azure Monitor to a Microsoft Sentinel or a partner SIEM and monitoring tools. What data can be sent into an event hub? Within your Azure environment, there are several 'tiers' of monitoring data, and the method of accessing data from each tier varies slightly.
- Application monitoring data - Data about the performance and functionality of the code you have written and are running on Azure. Examples of application monitoring data include performance traces, application logs, and user telemetry. Application monitoring data is usually collected in one of the following ways:
- By instrumenting your code with an SDK such as the Application Insights SDK.
- By running a monitoring agent that listens for new application logs on the machine running your application, such as the Windows Azure Diagnostic Agent or Linux Azure Diagnostic Agent.
- Guest OS monitoring data - Data about the operating system on which your application is running. Examples of guest OS monitoring data would be Linux syslog or Windows system events. To collect this type of data, you need to install an agent such as the Windows Azure Diagnostic Agent or Linux Azure Diagnostic Agent.
- Azure resource monitoring data - Data about the operation of an Azure resource. For some Azure resource types, such as virtual machines, there is a guest OS and application(s) to monitor inside of that Azure service. For other Azure resources, such as Network Security Groups, the resource monitoring data is the highest tier of data available (since there is no guest OS or application running in those resources). This data can be collected using resource diagnostic settings.
- Azure subscription monitoring data - Data about the operation and management of an Azure subscription, as well as data about the health and operation of Azure itself. The activity log contains most subscription monitoring data, such as service health incidents and Azure Resource Manager audits. You can collect this data using a Log Profile.
- Azure tenant monitoring data - Data about the operation of tenant-level Azure services, such as Microsoft Entra ID. The Microsoft Entra audits and sign-ins are examples of tenant monitoring data. This data can be collected using a tenant diagnostic setting.
Some of the features of Microsoft Sentinel are:
- More than 100 built-in alert rules
- Sentinel's alert rule wizard to create your own.
- Alerts can be triggered by a single event or based on a threshold, or by correlating different datasets or by using built-in machine learning algorithms.
- Jupyter Notebooks that use a growing collection of hunting queries, exploratory queries, and python libraries.
- Investigation graph for visualizing and traversing the connections between entities like users, assets, applications, or URLs and related activities like logins, data transfers, or application usage to rapidly understand the scope and impact of an incident.
To on-board Microsoft Sentinel: - Enable it - Connect your data sources with connectors that include Microsoft Threat Protection solutions, Microsoft 365 sources, Microsoft Entra ID, Azure ATP, and Microsoft Cloud App Security. In addition, there are built-in connectors to the broader security ecosystem for non-Microsoft solutions. You can also use common event format, Syslog or REST-API to connect your data sources with Azure Sentinel. - After you connect your data sources, choose from a gallery of expertly created dashboards that surface insights based on your data.
1.2. Configure and monitor metrics and logs
All data that Azure Monitor collects fits into one of two fundamental types: metrics or logs.
Azure Monitor Metrics. - Metrics are numerical values that are collected at regular intervals and describe some aspect of a system at a particular time. There are multiple types of metrics supported by Azure Monitor Metrics:
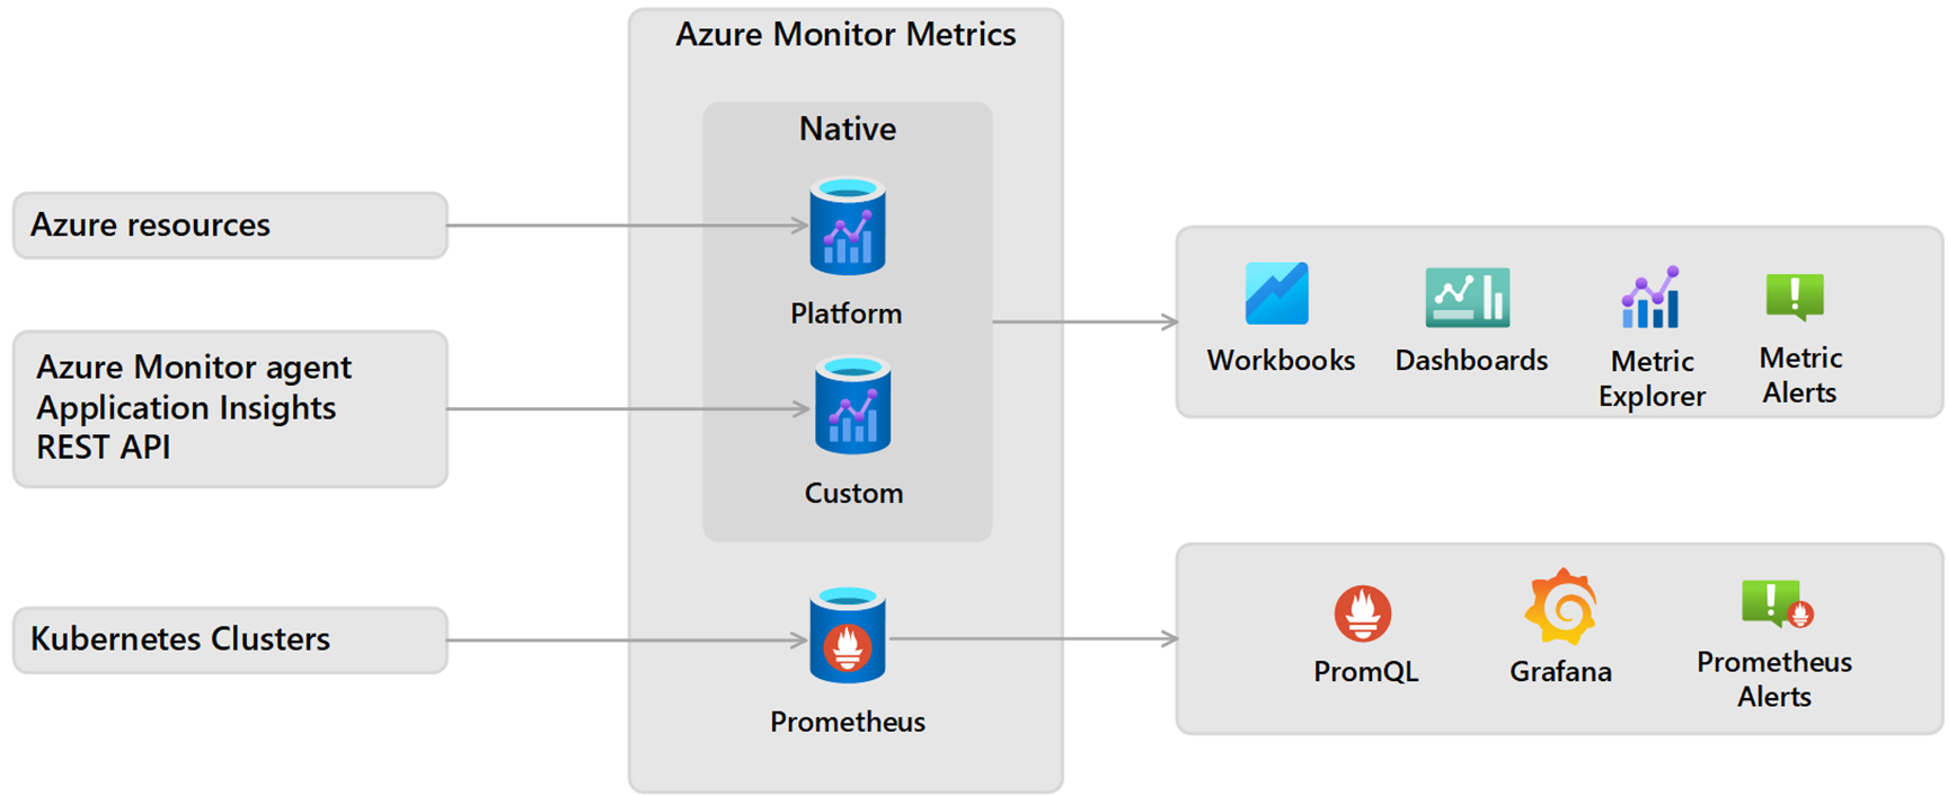
- Native metrics use tools in Azure Monitor for analysis and alerting.
- Platform metrics are collected from Azure resources. They require no configuration and have no cost.
- Custom metrics are collected from different sources that you configure, including applications and agents running on virtual machines.
- Prometheus metrics (preview) are collected from Kubernetes clusters, including Azure Kubernetes Service (AKS), and use industry-standard tools for analyzing and alerting, such as PromQL and Grafana.
What is Prometheus? Prometheus is an open-source toolkit that collects data for monitoring and alerting.
Prometheus Features:
- A multi-dimensional data model with time series data identified by metric name and key/value pairs
- PromQL (PromQL component called Prom Kubernetes - an extension to support Prometheus) provides a flexible query language to use this dimensionality.
- Time series collection happens via a pull model over Hypertext Transfer Protocol (HTTP)
- Pushing time series is supported via an intermediary gateway
- Targets are discovered via service discovery or static configuration
What is Azure Managed Grafana?
Azure Managed Grafana is a data visualization platform built on top of the Grafana software by Grafana Labs. It's built as a fully managed Azure service operated and supported by Microsoft. Grafana helps you combine metrics, logs, and traces into a single user interface. With its extensive support for data sources and graphing capabilities, you can view and analyze your application and infrastructure telemetry data in real-time.
Azure Managed Grafana is optimized for the Azure environment. It works seamlessly with many Azure services. Specifically, for the current preview, it provides with the following integration features:
- Built-in support for Azure Monitor and Azure Data Explorer
- User authentication and access control using Microsoft Entra identities
- Direct import of existing charts from the Azure portal
Why use Azure Managed Grafana?
Managed Grafana lets you bring together all your telemetry data into one place. It can access various data sources supported, including your data stores in Azure and elsewhere.
As a fully managed service, Azure Managed Grafana lets you deploy Grafana without having to deal with setup. The service provides high availability, service level agreement (SLA) guarantees, and automatic software updates.
You can share Grafana dashboards with people inside and outside your organization and allow others to join in for monitoring or troubleshooting. Managed Grafana uses Microsoft Entra ID’s centralized identity management, which allows you to control which users can use a Grafana instance, and you can use managed identities to access Azure data stores, such as Azure Monitor.
You can create dashboards instantaneously by importing existing charts directly from the Azure portal or by using prebuilt dashboards.
Summarizing:
| Category | Native platform metrics | Native custom metrics | Prometheus metrics (preview) |
|---|---|---|---|
| Sources | Azure resources | Azure Monitor agent Application Insights Representational State Transfer (REST) Application Programming Interface (API) |
Azure Kubernetes Service (AKS) cluster Any Kubernetes cluster through remote-write |
| Configuration | None | Varies by source | Enable Azure Monitor managed service for Prometheus |
| Stored | Subscription | Subscription | Azure Monitor workspace |
| Cost | No | Yes | Yes (free during preview) |
| Aggregation | pre-aggregated | pre-aggregated | raw data |
| Analyze | Metrics Explorer | Metrics Explorer | Prometheus Querying (PromQL) LanguageGrafana dashboards |
| Alert | metrics alert rule | metrics alert rule | Prometheus alert rule |
| Visualize | WorkbooksAzure dashboardGrafana | WorkbooksAzure dashboardGrafana | Grafana |
| Retrieve | Azure Command-Line Interface (CLI) Azure PowerShell cmdletsRepresentational State Transfer (REST) Application Programming Interface (API) or client library.NETGoJavaJavaScriptPython | Azure Command-Line Interface (CLI) Azure PowerShell cmdletsRepresentational State Transfer (REST) Application Programming Interface (API) or client library.NETGoJavaJavaScriptPython | Grafana |
Azure Monitor collects metrics from the following sources. After these metrics are collected in the Azure Monitor metric database, they can be evaluated together regardless of their source:
- Azure resources: Platform metrics are created by Azure resources and give you visibility into their health and performance. Each type of resource creates a distinct set of metrics without any configuration required. Platform metrics are collected from Azure resources at a one-minute frequency unless specified otherwise in the metric's definition.
- Applications: Application Insights creates metrics for your monitored applications to help you detect performance issues and track trends in how your application is used. Values include Server response time and Browser exceptions.
- Virtual machine agents: Metrics are collected from the guest operating system of a virtual machine. You can enable guest operating system (OS) metrics for Windows virtual machines using the Windows diagnostic extension and Linux virtual machines by using the InfluxData Telegraf agent.
- Custom metrics: You can define metrics in addition to the standard metrics that are automatically available. You can define custom metrics in your application that are monitored by Application Insights. You can also create custom metrics for an Azure service by using the custom metrics Application Programming Interface (API).
- Kubernetes clusters: Kubernetes clusters typically send metric data to a local Prometheus server that you must maintain. Azure Monitor managed service for Prometheus provides a managed service that collects metrics from Kubernetes clusters and stores them in Azure Monitor Metrics.
A common type of log entry is an event, which is collected sporadically.
Applications can create custom logs by using the structure that they need.
Metric data can even be stored in Logs to combine them with other monitoring data for trending and other data analysis.
KQL (Kusto query language). - Data in Azure Monitor Logs is retrieved using a log query written with the Kusto query language, which allows you to quickly retrieve, consolidate, and analyze collected data. Use Log Analytics to write and test log queries in the Azure portal. It allows you to work with results interactively or pin them to a dashboard to view them with other visualizations.
Security tools use of Monitor logs:
- Microsoft Defender for Cloud stores data that it collects in a Log Analytics workspace where it can be analyzed with other log data.
- Azure Sentinel stores data from data sources into a Log Analytics workspace.
1.3. Enable Log Analytics
Log Analytics is the primary tool in the Azure portal for writing log queries and interactively analyzing their results. Even if a log query is used elsewhere in Azure Monitor, you'll typically write and test the query first using Log Analytics.
You can start Log Analytics from several places in the Azure portal. The scope of the data available to Log Analytics is determined by how you start it.
- Select Logs from the Azure Monitor menu or Log Analytics workspaces menu.
- Select Analytics from the Overview page of an Application Insights application.
- Select Logs from the menu of an Azure resource.
In addition to interactively working with log queries and their results in Log Analytics, areas in Azure Monitor where you will use queries include the following:
- Alert rules. Alert rules proactively identify issues from data in your workspace. Each alert rule is based on a log search that is automatically run at regular intervals. The results are inspected to determine if an alert should be created.
- Dashboards. You can pin the results of any query into an Azure dashboard which allow you to visualize log and metric data together and optionally share with other Azure users.
- Views. You can create visualizations of data to be included in user dashboards with View Designer. Log queries provide the data used by tiles and visualization parts in each view.
- Export. When you import log data from Azure Monitor into Excel or Power BI, you create a log query to define the data to export.
- PowerShell. Use the results of a log query in a PowerShell script from a command line or an Azure Automation runbook that uses
Invoke-AzOperationalInsightsQuery. - Azure Monitor Logs API. The Azure Monitor Logs API allows any REST API client to retrieve log data from the workspace. The API request includes a query that is run against Azure Monitor to determine the data to retrieve.
At the center of Log Analytics is the Log Analytics workspace, which is hosted in Azure. - - Log Analytics collects data in the workspace from connected sources by configuring data sources and adding solutions to your subscription. - Data sources and solutions each create different record types, each with its own set of properties. - You can still analyze sources and solutions together in queries to the workspace. - A Log Analytics workspace is a unique environment for Azure Monitor log data. - Each workspace has its own data repository and configuration, and data sources and solutions are configured to store their data in a particular workspace. - You require a Log Analytics workspace if you intend on collecting data from the following sources: - Azure resources in your subscription - On-premises computers monitored by System Center Operations Manager - Device collections from Configuration Manager - Diagnostics or log data from Azure storage
1.4. Manage connected sources for log analytics
- The Azure Log Analytics agent was developed for comprehensive management across virtual machines in any cloud, on-premises machines, and those monitored by System Center Operations Manager.
- The Windows and Linux agents send collected data from different sources to your Log Analytics workspace in Azure Monitor, as well as any unique logs or metrics as defined in a monitoring solution.
- The Log Analytics agent also supports insights and other services in Azure Monitor such as Azure Monitor for VMs, Microsoft Defender for Cloud, and Azure Automation.
There is something else called Azure diagnostics extension, that basically collects monitoring data from the guest operating system of Azure virtual machines. Differences:
| Azure Diagnostics Extension | Log Analytics agent |
|---|---|
| Used only with Azure virtual machines. | Used with virtual machines in Azure, other clouds, and on-premises. |
| Sends data to Azure Storage, Azure Monitor Metrics (Windows only) and Event Hubs. | Sends data to Azure Monitor Logs (to an Log Analytics Workspace). |
| Not required specifically | Required for: Azure Monitor for VMs, and other services such as Microsoft Defender for Cloud. |
The Windows agent can be multihomed to send data to multiple workspaces and System Center Operations Manager management groups. The Linux agent can send to only a single destination. The agent for Linux and Windows isn't only for connecting to Azure Monitor, it also supports Azure Automation to host the Hybrid Runbook worker role and other services such as Change Tracking, Update Management, and Microsoft Defender for Cloud.
1.5. Enable Azure monitor Alerts
Azure monitor has metrics, logging, and analytics features. Another feature is Monitor Alerts.
Alerts in Azure Monitor proactively notify you of critical conditions and potentially attempt to take corrective action. Alert rules based on metrics provide near real time alerting based on numeric values, while rules based on logs allow for complex logic across data from multiple sources.
The unified alert experience in Azure Monitor includes alerts that were previously managed by Log Analytics and Application Insights. In the past, Azure Monitor, Application Insights, Log Analytics, and Service Health had separate alerting capabilities. Over time, Azure improved and combined both the user interface and different methods of alerting. The consolidation is still in process.
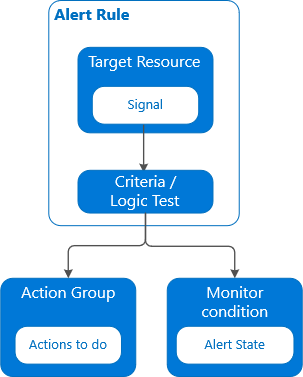
- The alert rule captures the target and criteria for alerting. The alert rule can be in an enabled or a disabled state. Alerts only fire when enabled.
- Target Resource: Defines the scope and signals available for alerting. A target can be any Azure resource. Example targets: a virtual machine, a storage account, a virtual machine scale set, a Log Analytics workspace, or an Application Insights resource. For certain resources (like virtual machines), you can specify multiple resources as the target of the alert rule.
- Signal: Emitted by the target resource. Signals can be of the following types: metric, activity log, Application Insights, and log.
- Criteria: A combination of signal and logic applied on a target resource. Examples:
- Percentage CPU > 70%
- Server Response Time > 4 ms
- Result count of a log query > 100
- Alert Name: A specific name for the alert rule configured by the user.
- Alert Description: A description for the alert rule configured by the user.
- Severity: The severity of the alert after the criteria specified in the alert rule is met. Severity can range from 0 to 4.
- Sev 0 = Critical
- Sev 1 = Error
- Sev 2 = Warning
- Sev 3 = Informational
- Sev 4 = Verbose
- Action: A specific action taken when the alert is fired.
You can alert on metrics and logs. These include but are not limited to:
- Metric values
- Log search queries
- Activity log events
- Health of the underlying Azure platform
- Tests for website availability
With the consolidation of alerting services still in process, there are some alerting capabilities that are not yet in the new alerts system.
| Monitor source | Signal type | Description |
|---|---|---|
| Service health | Activity log | Not supported. View Create activity log alerts on service notifications. |
| Application Insights | Web availability tests | Not supported. View Web test alerts. Available to any website that's instrumented to send data to Application Insights. Receive a notification when availability or responsiveness of a website is below expectations. |
1.6. Create diagnostic settings in Azure portal
Azure Monitor diagnostic logs are logs produced by an Azure service that provide rich, frequently collected data about the operation of that service. Azure Monitor makes two types of diagnostic logs available:
- Tenant logs. These logs come from tenant-level services that exist outside an Azure subscription, such as Microsoft Entra ID.
- Resource logs. These logs come from Azure services that deploy resources within an Azure subscription, such as Network Security Groups (NSGs) or storage accounts.
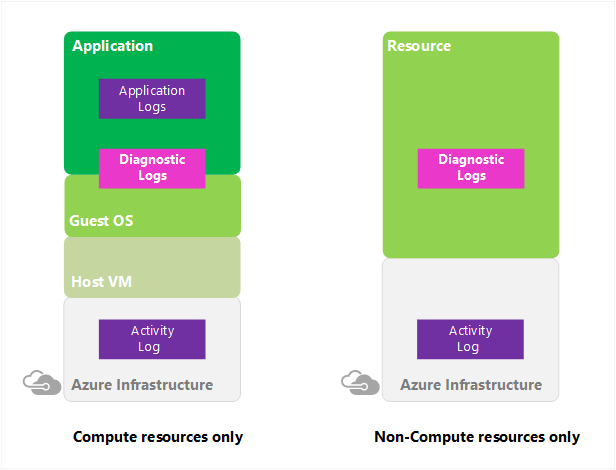
These logs differ from the activity log. The activity log provides insight into the operations, such as creating a VM or deleting a logic app, that Azure Resource Manager performed on resources in your subscription using. The activity log is a subscription-level log. Resource-level diagnostic logs provide insight into operations that were performed within that resource itself, such as getting a secret from a key vault.
These logs also differ from guest operating system (OS)–level diagnostic logs. Guest OS diagnostic logs are those collected by an agent running inside a VM or other supported resource type. Resource-level diagnostic logs require no agent and capture resource-specific data from the Azure platform itself, whereas guest OS–level diagnostic logs capture data from the OS and applications running on a VM.
You can configure diagnostic settings in the Azure portal either from the Azure Monitor menu or from the menu for the resource.
Here are some of the things you can do with diagnostic logs:
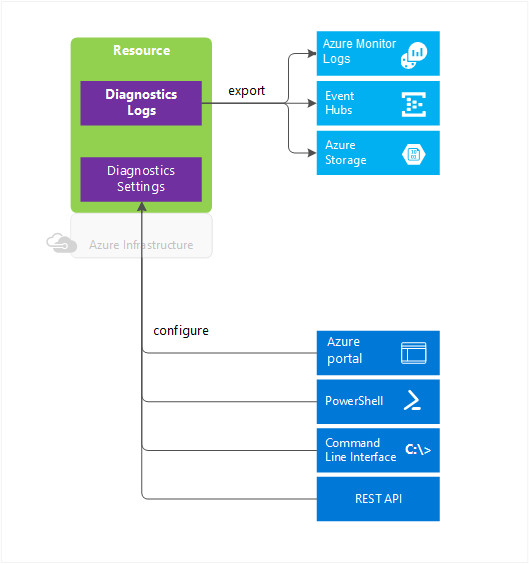
- Save them to a storage account for auditing or manual inspection. You can specify the retention time (in days) by using resource diagnostic settings.
- Stream them to event hubs for ingestion by a third-party service or custom analytics solution, such as Power BI.
- Analyze them with Azure Monitor, such that the data is immediately written to Azure Monitor with no need to first write the data to storage.
- An event hub is created in the namespace for each log category you enable. A diagnostic log category is a type of log that a resource may collect.
Kusto Query Language. All data is retrieved from a Log Analytics workspace using a log query written using Kusto Query Language (KQL). You can write your own queries or use solutions and insights that include log queries for an application or service.
2. Enable and manage Microsoft Defender for Cloud
Microsoft Defender for Cloud is your central location for setting and monitoring your organization's security posture.
2.1. The MITRE Attack matrix
The MITRE ATT&CK matrix is a publicly accessible knowledge base for understanding the various tactics and techniques used by attackers during a cyberattack.
The knowledge base is organized into several categories: pre-attack, initial access, execution, persistence, privilege escalation, defense evasion, credential access, discovery, lateral movement, collection, exfiltration, and command and control.
Tactics (T) represent the "why" of an ATT&CK technique or sub-technique. It is the adversary's tactical goal: the reason for performing an action. For example, an adversary may want to achieve credential access.
Techniques (T) represent "how'" an adversary achieves a tactical goal by performing an action. For example, an adversary may dump credentials to achieve credential access.
Common Knowledge (CK) in ATT&CK stands for common knowledge, essentially the documented modus operandi of tactics and techniques executed by adversaries.
Defender for Cloud uses the MITRE Attack matrix to associate alerts with their perceived intent, helping formalize security domain knowledge.
2.2. Implement Microsoft Defender for Cloud
Microsoft Defender for Cloud is a solution for cloud security posture management (CSPM) and cloud workload protection (CWP) that finds weak spots across your cloud configuration, helps strengthen the overall security posture of your environment, and can protect workloads across multicloud and hybrid environments from evolving threats.
When necessary, Defender for Cloud can automatically deploy a Log Analytics agent to gather security-related data. For Azure machines, deployment is handled directly. For hybrid and multicloud environments, Microsoft Defender plans are extended to non-Azure machines with the help of Azure Arc. Cloud Security Posture Management (CSPM) features are extended to multicloud machines without the need for any agents.
In addition to defending your Azure environment, you can add Defender for Cloud capabilities to your hybrid cloud environment to protect your non-Azure servers. To extend protection to on-premises machines, deploy Azure Arc and enable Defender for Cloud's enhanced security features.
For example, if you've connected an Amazon Web Services (AWS) account to an Azure subscription, you can enable any of these protections:
- Defender for Cloud's CSPM features extend to your AWS resources. This agentless plan assesses your AWS resources according to AWS-specific security recommendations, and these are included in your secure score. The resources will also be assessed for compliance with built-in standards specific to AWS (AWS Center for Internet Security (CIS), AWS Payment Card Industry (PCI) Data Security Standards (DSS), and AWS Foundational Security Best Practices). Defender for Cloud's asset inventory page is a multicloud enabled feature helping you manage your AWS resources alongside your Azure resources.
- Microsoft Defender for Kubernetes extends its container threat detection and advanced defenses to your Amazon Elastic Kubernetes Service (EKS) Linux clusters.
- Microsoft Defender for Servers brings threat detection and advanced defenses to your Windows and Linux Elastic Compute Cloud 2 (EC2) instances. This plan includes the integrated license for Microsoft Defender for Endpoint, security baselines, and OS level assessments, vulnerability assessment scanning, adaptive application controls (AAC), file integrity monitoring (FIM), and more.
Defender for Cloud includes vulnerability assessment solutions for virtual machines, container registries, and SQL servers as part of the enhanced security features. Some of the scanners are powered by Qualys. But you don't need a Qualys license or even a Qualys account - everything's handled seamlessly inside Defender for Cloud.
Microsoft Defender for Servers includes automatic, native integration with Microsoft Defender for Endpoint. With this integration enabled, you'll have access to the vulnerability findings from Microsoft Defender Vulnerability Management.
The list of recommendations is enabled and supported by the Microsoft cloud security benchmark. This Microsoft-authored benchmark, based on common compliance frameworks, began with Azure and now provides a set of guidelines for security and compliance best practices for multiple cloud environments. In this way, Defender for Cloud enables you not just to set security policies but to apply secure configuration standards across your resources.
Microsoft Defender for the Internet of Things (IoT) is a separate product.
The Defender plans of Microsoft Defender for Cloud offer comprehensive defenses for the compute, data, and service layers of your environment:
- Microsoft Defender for Servers
- Microsoft Defender for Storage
- Microsoft Defender for Structured Query Language (SQL)
- Microsoft Defender for Containers
- Microsoft Defender for App Service
- Microsoft Defender for Key Vault
- Microsoft Defender for Resource Manager
- Microsoft Defender for Domain Name System (DNS)
- Microsoft Defender for open-source relational databases
- Microsoft Defender for Azure Cosmos Database (DB)
- Defender Cloud Security Posture Management (CSPM)
- Security governance and regulatory compliance
- Cloud security explorer
- Attack path analysis
- Agentless scanning for machines
- Defender for DevOps
- Security alerts - When Defender for Cloud detects a threat in any area of your environment, it generates a security alert. These alerts describe details of the affected resources, suggested remediation steps, and in some cases, an option to trigger a logic app in response. Whether an alert is generated by Defender for Cloud or received by Defender for Cloud from an integrated security product, you can export it. To export your alerts to Microsoft Sentinel, any third-party Security information and event management (SIEM), or any other external tool, follow the instructions in Stream alerts to a SIEM, Security orchestration, automation and response (SOAR), or IT Service Management solution. Defender for Cloud's threat protection includes fusion kill-chain analysis, which automatically correlates alerts in your environment based on cyber kill-chain analysis, to help you better understand the full story of an attack campaign, where it started, and what kind of impact it had on your resources. Defender for Cloud's supported kill chain intents are based on version 9 of the MITRE ATT&CK matrix.
2.3. Cloud Security Posture Management (CSPM) - Remediate security issues and watch your security posture improve - Security posture tab + Regulatory compliance tab
Defender for Cloud continually assesses your resources, subscriptions, and organization for security issues and shows your security posture in the secure score, an aggregated score of the security findings that tells you, at a glance, your current security situation: the higher the score, the lower the identified risk level.
- Generates a secure score for your subscriptions based on an assessment of your connected resources compared with the guidance in the Microsoft cloud security benchmark.
- Provides hardening recommendations based on any identified security misconfigurations and weaknesses.
- Analyzes and secure's your attack paths through the cloud security graph, which is a graph-based context engine that exists within Defender for Cloud. The cloud security graph collects data from your multicloud environment and other data sources.
- Attack path analysis is a graph-based algorithm that scans the cloud security graph. The scans expose exploitable paths attackers may use to breach your environment to reach your high-impact assets.
2.4. Workload protections tab
Defender for Cloud offers security alerts that are powered by Microsoft Threat Intelligence. It also includes a range of advanced, intelligent protections for your workloads. The workload protections are provided through Microsoft Defender plans specific to the types of resources in your subscriptions.
The Cloud workload dashboard includes the following sections:
- Microsoft Defender for Cloud coverage - Here you can see the resources types in your subscription that are eligible for protection by Defender for Cloud. Wherever relevant, you can upgrade here as well. If you want to upgrade all possible eligible resources, select Upgrade all.
- Security alerts - When Defender for Cloud detects a threat in any area of your environment, it generates an alert. These alerts describe details of the affected resources, suggested remediation steps, and in some cases an option to trigger a logic app in response. Selecting anywhere in this graph opens the Security alerts page.
- Advanced protection - Defender for Cloud includes many advanced threat protection capabilities for virtual machines, Structured Query Language (SQL) databases, containers, web applications, your network, and more. In this advanced protection section, you can see the status of the resources in your selected subscriptions for each of these protections. Select any of them to go directly to the configuration area for that protection type.
- Insights - This rolling pane of news, suggested reading, and high priority alerts gives Defender for Cloud's insights into pressing security matters that are relevant to you and your subscription. Whether it's a list of high severity Common Vulnerabilities and Exposures (CVEs) discovered on your VMs by a vulnerability analysis tool, or a new blog post by a member of the Defender for Cloud team, you'll find it here in the Insights panel.
2.5. Deploy Microsoft Defender for Cloud
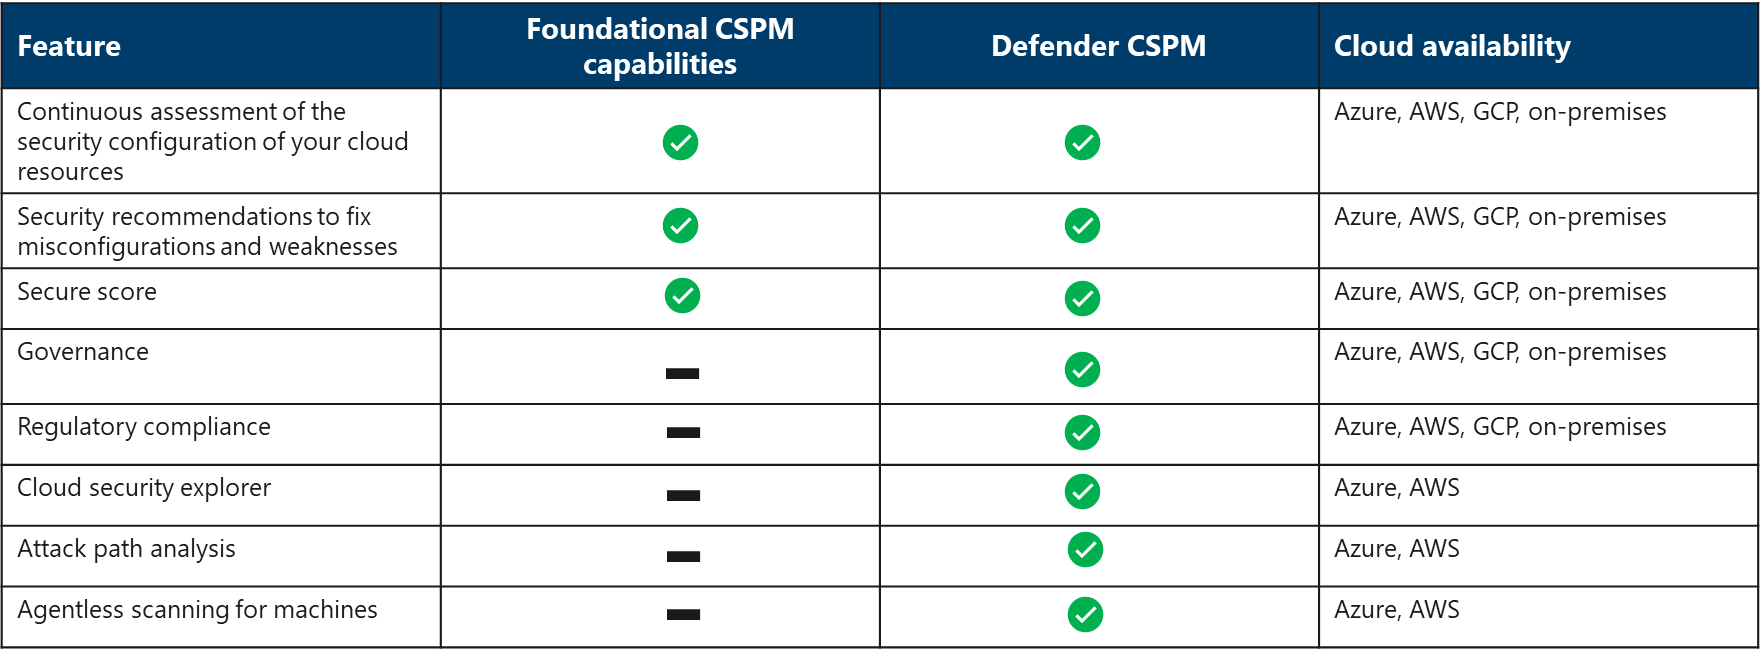
Defender for Cloud provides foundational cloud security and posture management (CSPM) features by default.
Defender for cloud offers foundational multicloud CSPM capabilities for free. The foundational CSPM includes a secure score, security policy and basic recommendations, and network security assessment to help you protect your Azure resources.
The optional Defender CSPM plan provides advanced posture management capabilities such as Attack path analysis, Cloud security explorer, advanced threat hunting, security governance capabilities, and also tools to assess your security compliance with a wide range of benchmarks, regulatory standards, and any custom security policies required in your organization, industry, or region.
When you enabled Defender plans on an entire Azure subscription, the protections are inherited by all resources in the subscription. When you enable the enhanced security features (paid), Defender for Cloud can provide unified security management and threat protection across your hybrid cloud workloads, including:
-
Microsoft Defender for Endpoint - Microsoft Defender for Servers includes Microsoft Defender for Endpoint for comprehensive endpoint detection and response (EDR).
-
Vulnerability assessment for virtual machines, container registries, and SQL resources
-
Multicloud security - Connect your accounts from Amazon Web Services (AWS) and Google Cloud Platform (GCP) to protect resources and workloads on those platforms with a range of Microsoft Defender for Cloud security features.
-
Hybrid security – Get a unified view of security across all of your on-premises and cloud workloads.
-
Threat protection alerts - Advanced behavioral analytics and the Microsoft Intelligent Security Graph provide an edge over evolving cyber-attacks. Built-in behavioral analytics and machine learning can identify attacks and zero-day exploits. Monitor networks, machines, data stores (SQL servers hosted inside and outside Azure, Azure SQL databases, Azure SQL Managed Instance, and Azure Storage), and cloud services for incoming attacks and post-breach activity. Streamline investigation with interactive tools and contextual threat intelligence.
-
Track compliance with a range of standards - Defender for Cloud continuously assesses your hybrid cloud environment to analyze the risk factors according to the controls and best practices in the Microsoft cloud security benchmark. When you enable enhanced security features, you can apply a range of other industry standards, regulatory standards, and benchmarks according to your organization's needs. Add standards and track your compliance with them from the regulatory compliance dashboard.
-
Access and application controls - Block malware and other unwanted applications by applying machine learning-powered recommendations adapted to your specific workloads to create allowlists and blocklists. Reduce the network attack surface with just-in-time, controlled access to management ports on Azure VMs. Access and application control drastically reduce exposure to brute force and other network attacks.
-
Container security features - Benefit from vulnerability management and real-time threat protection in your containerized environments. Charges are based on the number of unique container images pushed to your connected registry. After an image has been scanned once, you won't be charged for it again unless it's modified and pushed once more.
-
Breadth threat protection for resources connected to Azure - Cloud-native threat protection for the Azure services common to all of your resources: Azure Resource Manager, Azure Domain Name System (DNS), Azure network layer, and Azure Key Vault. Defender for Cloud has unique visibility into the Azure management layer and the Azure DNS layer and can therefore protect cloud resources that are connected to those layers.
Manage your Cloud Security Posture Management (CSPM) - CSPM offers you the ability to remediate security issues and review your security posture through the tools provided. These tools include:
- Security governance and regulatory compliance
- What is Security governance and regulatory compliance? Security governance and regulatory compliance refer to the policies and processes which organizations have in place to ensure that they comply with laws, rules, and regulations put in place by external bodies (government) that control activity in a given jurisdiction. Defender for Cloud allows you to view your regulatory compliance through the regulatory compliance dashboard. Defender for Cloud continuously assesses your hybrid cloud environment to analyze the risk factors according to the controls and best practices in the standards you've applied to your subscriptions. The dashboard reflects the status of your compliance with these standards.
- Cloud security graph
- What is a cloud security graph? The cloud security graph is a graph-based context engine that exists within Defender for Cloud. The cloud security graph collects data from your multicloud environment and other data sources. For example, the cloud assets inventory, connections and lateral movement possibilities between resources, exposure to the internet, permissions, network connections, vulnerabilities, and more. The data collected is then used to build a graph representing your multicloud environment. Defender for Cloud then uses the generated graph to perform an attack path analysis and find the issues with the highest risk that exist within your environment. You can also query the graph using the cloud security explorer.
- Attack path analysis
- What is Attack path analysis? Attack path analysis helps you to address the security issues that pose immediate threats with the greatest potential of being exploited in your environment. Defender for Cloud analyzes which security issues are part of potential attack paths that attackers could use to breach your environment. It also highlights the security recommendations that need to be resolved in order to mitigate the issue.
- Agentless scanning for machines
- What is agentless scanning for machines? Microsoft Defender for Cloud maximizes coverage on OS posture issues and extends beyond the reach of agent-based assessments. With agentless scanning for VMs, you can get frictionless, wide, and instant visibility on actionable posture issues without installed agents, network connectivity requirements, or machine performance impact. Agentless scanning for VMs provides vulnerability assessment and software inventory powered by Defender vulnerability management in Azure and Amazon AWS environments. Agentless scanning is available in Defender Cloud Security Posture Management (CSPM) and Defender for Servers.
2.6. Azure Arc
Azure Arc provides a centralized, unified way to:
- Manage your entire environment together by projecting your existing non-Azure and/or on-premises resources into Azure Resource Manager.
- Manage virtual machines, Kubernetes clusters, and databases as if they are running in Azure.
- Use familiar Azure services and management capabilities, regardless of where they live.
- Continue using traditional IT operations (ITOps) while introducing DevOps practices to support new cloud-native patterns in your environment.
- Configure custom locations as an abstraction layer on top of Azure Arc-enabled Kubernetes clusters and cluster extensions.
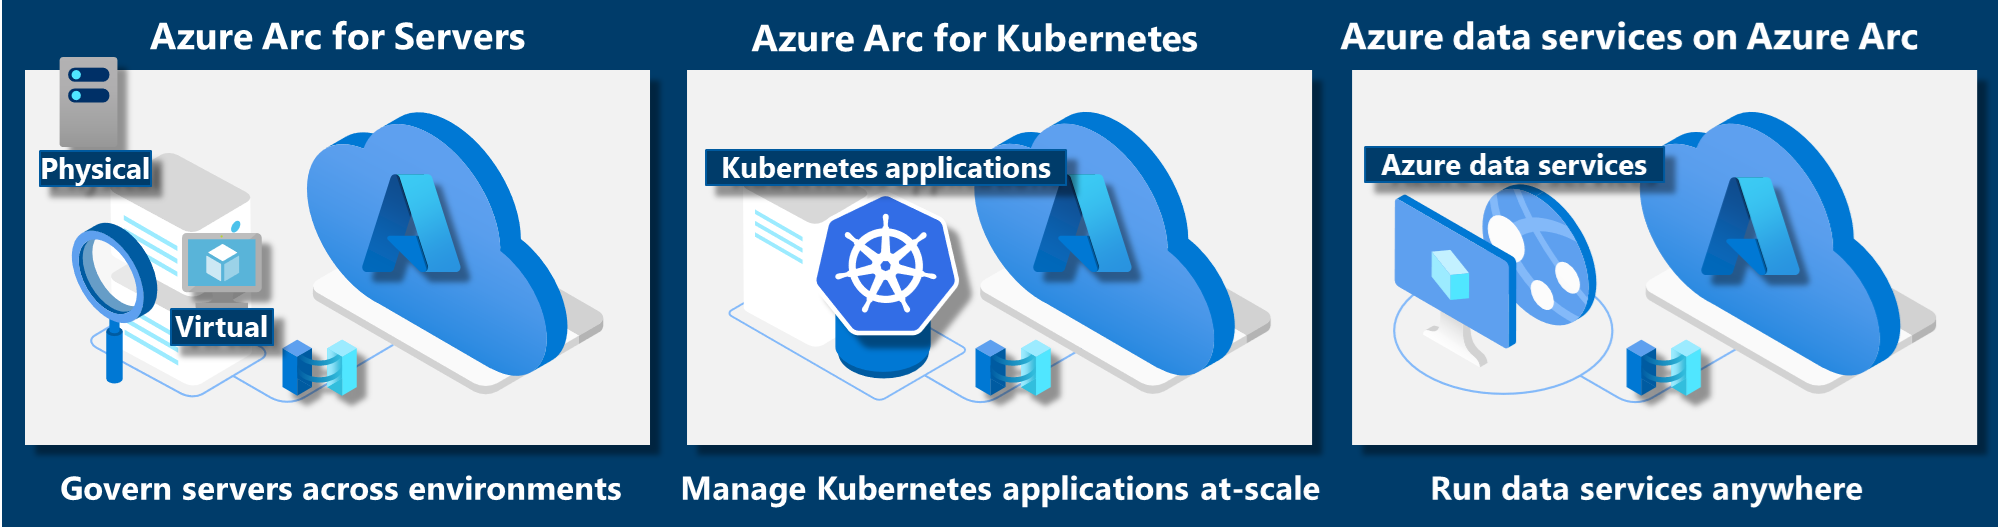
Currently, Azure Arc allows you to manage the following resource types hosted outside of Azure:
- Servers: Manage Windows and Linux physical servers and virtual machines hosted outside of Azure.
- Kubernetes clusters: Attach and configure Kubernetes clusters running anywhere with multiple supported distributions.
- Azure data services: Run Azure data services on-premises, at the edge, and in public clouds using Kubernetes and the infrastructure of your choice. SQL Managed Instance and PostgreSQL server (preview) services are currently available.
- SQL Server: Extend Azure services to SQL Server instances hosted outside of Azure.
- Virtual machines (preview): Provision, resize, delete, and manage virtual machines based on VMware vSphere or Azure Stack hyper-converged infrastructure (HCI) and enable VM self-service through role-based access.
Some of the key scenarios that Azure Arc supports are:
- Implement consistent inventory, management, governance, and security for servers across your environment.
- Configure Azure VM extensions to use Azure management services to monitor, secure, and update your servers.
- Manage and govern Kubernetes clusters at scale.
- Use GitOps to deploy configuration across one or more clusters from Git repositories.
- Zero-touch compliance and configuration for Kubernetes clusters using Azure Policy.
- Run Azure data services on any Kubernetes environment as if it runs in Azure (specifically Azure SQL Managed Instance and Azure Database for PostgreSQL server, with benefits such as upgrades, updates, security, and monitoring). Use elastic scale and apply updates without any application downtime, even without continuous connection to Azure.
- Create custom locations on top of your Azure Arc-enabled Kubernetes clusters, using them as target locations for deploying Azure services instances. Deploy your Azure service cluster extensions for Azure Arc-enabled data services, App services on Azure Arc (including web, function, and logic apps), and Event Grid on Kubernetes.
- Perform virtual machine lifecycle and management operations for VMware vSphere and Azure Stack hyper-converged infrastructure (HCI) environments.
- A unified experience viewing your Azure Arc-enabled resources, whether you are using the Azure portal, the Azure CLI, Azure PowerShell, or Azure REST API.
2.7. Microsoft cloud security benchmark
Located at Defender > Regulatory compliance
The Microsoft cloud security benchmark (MCSB) provides prescriptive best practices and recommendations to help improve the security of workloads, data, and services on Azure and your multi-cloud environment, focusing on cloud-centric control areas with input from a set of holistic Microsoft and industry security guidance that includes:
- Cloud Adoption Framework: Guidance on security, including strategy, roles and responsibilities, Azure Top 10 Security Best Practices, and reference implementation.
- Azure Well-Architected Framework: Guidance on securing your workloads on Azure.
- The Chief Information Security Officer (CISO) Workshop: Program guidance and reference strategies to accelerate security modernization using Zero Trust principles.
- Other industry and cloud service provider's security best practice standards and framework: Examples include the Amazon Web Services (AWS) Well-Architected Framework, Center for Internet Security (CIS) Controls, National Institute of Standards and Technology (NIST), and Payment Card Industry Data Security Standard (PCI-DSS).
| Control Domains | Description |
|---|---|
| Network security (NS) | Network Security covers controls to secure and protect networks, including securing virtual networks, establishing private connections, preventing and mitigating external attacks, and securing Domain Name System (DNS). |
| Identity Management (IM) | Identity Management covers controls to establish a secure identity and access controls using identity and access management systems, including the use of single sign-on, strong authentications, managed identities (and service principals) for applications, conditional access, and account anomalies monitoring. |
| Privileged Access (PA) | Privileged Access covers controls to protect privileged access to your tenant and resources, including a range of controls to protect your administrative model, administrative accounts, and privileged access workstations against deliberate and inadvertent risk. |
| Data Protection (DP) | Data Protection covers control of data protection at rest, in transit, and via authorized access mechanisms, including discover, classify, protect, and monitoring sensitive data assets using access control, encryption, key management, and certificate management. |
| Asset Management (AM) | Asset Management covers controls to ensure security visibility and governance over your resources, including recommendations on permissions for security personnel, security access to asset inventory and managing approvals for services and resources (inventory, track, and correct). |
| Logging and Threat Detection (LT) | Logging and Threat Detection covers controls for detecting threats on the cloud and enabling, collecting, and storing audit logs for cloud services, including enabling detection, investigation, and remediation processes with controls to generate high-quality alerts with native threat detection in cloud services; it also includes collecting logs with a cloud monitoring service, centralizing security analysis with a security event management (SEM), time synchronization, and log retention. |
| Incident Response (IR) | Incident Response covers controls in the incident response life cycle - preparation, detection and analysis, containment, and post-incident activities, including using Azure services (such as Microsoft Defender for Cloud and Sentinel) and/or other cloud services to automate the incident response process. |
| Posture and Vulnerability Management (PV) | Posture and Vulnerability Management focuses on controls for assessing and improving the cloud security posture, including vulnerability scanning, penetration testing, and remediation, as well as security configuration tracking, reporting, and correction in cloud resources. |
| Endpoint Security (ES) | Endpoint Security covers controls in endpoint detection and response, including the use of endpoint detection and response (EDR) and anti-malware service for endpoints in cloud environments. |
| Backup and Recovery (BR) | Backup and Recovery covers controls to ensure that data and configuration backups at the different service tiers are performed, validated, and protected. |
| DevOps Security (DS) | DevOps Security covers the controls related to the security engineering and operations in the DevOps processes, including deployment of critical security checks (such as static application security testing and vulnerability management) prior to the deployment phase to ensure the security throughout the DevOps process; it also includes common topics such as threat modeling and software supply security. |
| Governance and Strategy (GS) | Governance and Strategy provides guidance for ensuring a coherent security strategy and documented governance approach to guide and sustain security assurance, including establishing roles and responsibilities for the different cloud security functions, unified technical strategy, and supporting policies and standards. |
2.8. Security policies and Defender for Cloud initiatives
Like security policies, Defender for Cloud initiatives are also created in Azure Policy. You can use Azure Policy to manage your policies, build initiatives, and assign initiatives to multiple subscriptions or entire management groups.
The default initiative automatically assigned to every subscription in Microsoft Defender for Cloud is the Microsoft cloud security benchmark.
2.9. View and edit security policies
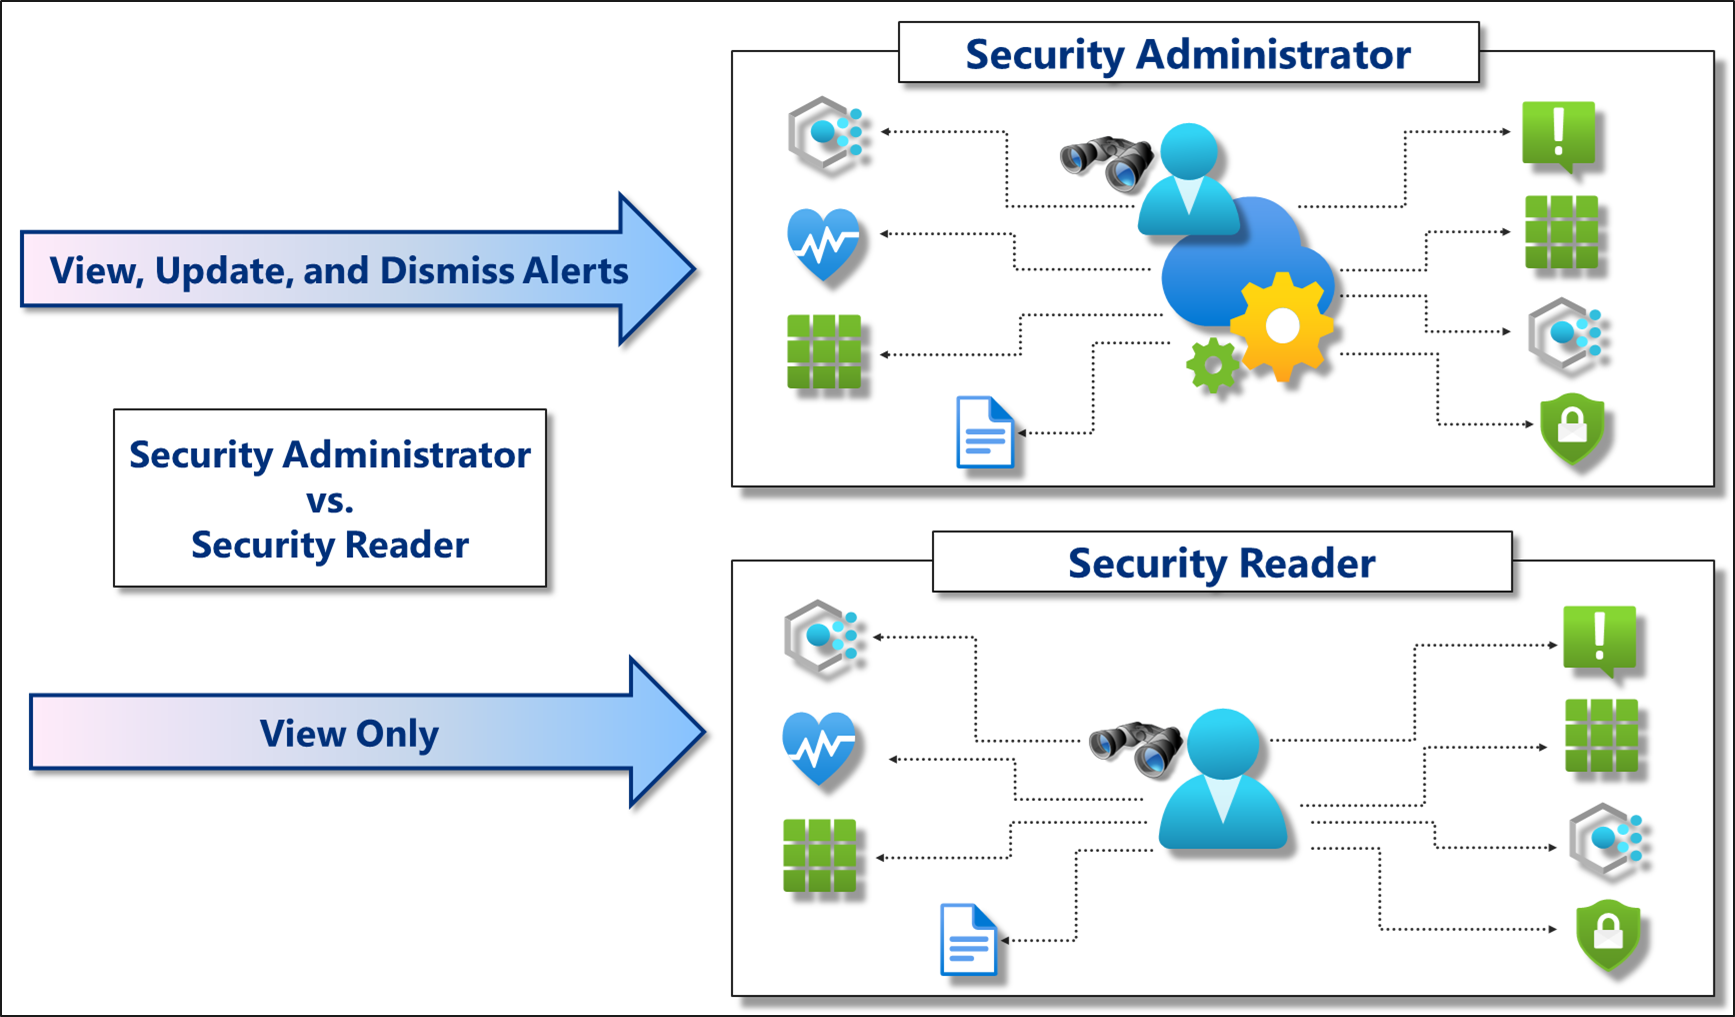
There are two specific roles for Defender for Cloud:
- Security Administrator: Has the same view rights as security reader. Can also update the security policy and dismiss alerts.
- Security reader: Has rights to view Defender for Cloud items such as recommendations, alerts, policy, and health. Can't make changes.
You can edit security policies through the Azure Policy portal via Representational State Transfer Application Programming Interface (REST API) or using Windows PowerShell.
The Security Policy screen reflects the action taken by the policies assigned to the subscription or management group you selected.
- Use the links at the top to open a policy assignment that applies to the subscription or management group. These links let you access the assignment and edit or disable the policy. For example, if you see that a particular policy assignment is effectively denying endpoint protection, use the link to edit or disable the policy.
- In the list of policies, you can see the effective application of the policy on your subscription or management group. The settings of each policy that apply to the scope are taken into consideration, and the cumulative outcome of actions taken by the policy is shown. For example, if one assignment of the policy is disabled, but in another, it's set to AuditIfNotExist, then the cumulative effect applies AuditIfNotExist. The more active effect always takes precedence.
- The policies' effect can be: Append, Audit, AuditIfNotExists, Deny, DeployIfNotExists, or Disabled.
2.10. Microsoft Defender for Cloud recommendations
In practice, it works like this:
-
Microsoft Cloud security benchmark is an initiative that contains requirements.
For example, Azure Storage accounts must restrict network access to reduce their attack surface.
-
The initiative includes multiple policies, each requiring a specific resource type. These policies enforce the requirements in the initiative.
To continue the example, the storage requirement is enforced with the policy "Storage accounts should restrict network access using virtual network rules."
-
Microsoft Defender for Cloud continually assesses your connected subscriptions. If it finds a resource that doesn't satisfy a policy, it displays a recommendation to fix that situation and harden the security of resources that aren't meeting your security requirements.
For example, if an Azure Storage account on your protected subscriptions isn't protected with virtual network rules, you see the recommendation to harden those resources.
So, (1) an initiative includes (2) policies that generate (3) environment-specific recommendations.
Defender for Cloud continually assesses your cross-cloud resources for security issues. It then aggregates all the findings into a single score so that you can tell, at a glance, your current security situation: the higher the score, the lower the identified risk level.
In the Azure mobile app, the secure score is shown as a percentage value, and you can tap the secure score to see the details that explain the score:
To increase your security, review Defender for Cloud's recommendations page and remediate the recommendation by implementing the remediation instructions for each issue. Recommendations are grouped into security controls. Each control is a logical group of related security recommendations and reflects your vulnerable attack surfaces. Your score only improves when you remediate all of the recommendations for a single resource within a control.
-
Insights - Gives you extra details for each recommendation, such as:
 Preview recommendation - This recommendation won't affect your secure score until general availability (GA).
 Fix - From within the recommendation details page, you can use 'Fix' to resolve this issue.
 Enforce - From within the recommendation details page, you can automatically deploy a policy to fix this issue whenever someone creates a non-compliant resource.
 Deny - From within the recommendation details page, you can prevent new resources from being created with this issue.
Which recommendations are included in the secure score calculations?
- Only built-in recommendations have an impact on the secure score.
- Recommendations flagged as Preview aren't included in the calculations of your secure score. They should still be remediated wherever possible so that when the preview period ends, they'll contribute towards your score.
- Preview recommendations are marked with:
2.11. Brute force attacks
To counteract brute-force attacks, you can take multiple measures such as:
-
Disable the public IP address and use one of these connection methods:
- Use a point-to-site virtual private network (VPN)
- Create a site-to-site VPN
- Use Azure ExpressRoute to create secure links from your on-premises network to Azure.
- Require two-factor authentication
-
Increase password length and complexity
-
Limit login attempts
-
Implement Captcha
- About CAPTCHAs - Any time you let people register on your site or even enter a name and URL (like for a blog comment), you might get a flood of fake names. These are often left by automated programs (bots) that try to leave URLs on every website they can find. (A common motivation is to post the URLs of products for sale.) You can help make sure that a user is a real person and not a computer program by using a CAPTCHA to validate users when they register or otherwise enter their name and site.
- CAPTCHA stands for Completely Automated Public Turing test to tell Computers and Humans Apart. A CAPTCHA is a challenge-response test in which the user is asked to do something that is easy for a person to do but hard for an automated program to do. The most common type of CAPTCHA is one where you see distorted letters and are asked to type them. (The distortion is supposed to make it hard for bots to decipher the letters.)
- Limit the amount of time that the ports are open.
Just-in-time VM access
Threat actors actively hunt accessible machines with open management ports, like remote desktop protocol (RDP) or secure shell protocol (SSH). All of your virtual machines are potential targets for an attack. When a VM is successfully compromised, it's used as the entry point to attack further resources within your environment.
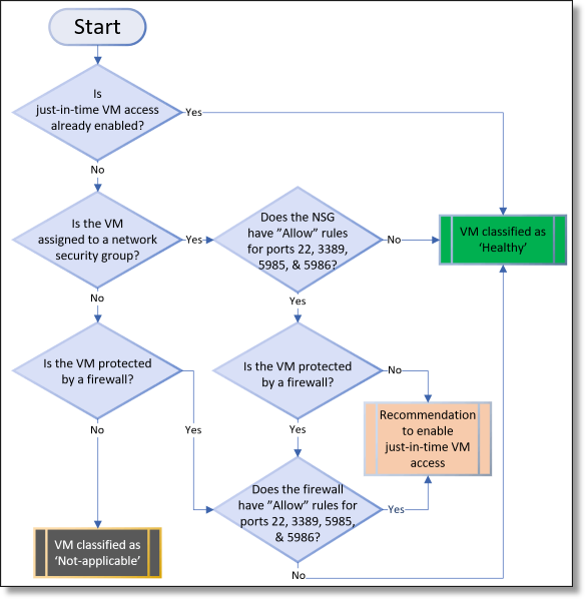
The diagram shows the logic Defender for Cloud applies when deciding how to categorize your supported VM. When Defender for Cloud finds a machine that can benefit from JIT, it adds that machine to the recommendation's Unhealthy resources tab.
Just-in-time (JIT) virtual machine (VM) access is used to lock down inbound traffic to your Azure VMs, reducing exposure to attacks while providing easy access to connect to VMs when needed. When you enable JIT VM Access for your VMs, you next create a policy that determines the ports to help protect, how long ports should remain open, and the approved IP addresses that can access these ports. The policy helps you stay in control of what users can do when they request access. Requests are logged in the Azure activity log, so you can easily monitor and audit access. The policy will also help you quickly identify the existing VMs that have JIT VM Access enabled and the VMs where JIT VM Access is recommended.
3. Configure and monitor Microsoft Sentinel
3.1. What is Microsoft Sentinel
Microsoft Sentinel is a scalable, cloud-native, security information event management (SIEM) and security orchestration automated response (SOAR) solution. Microsoft Sentinel delivers intelligent security analytics and threat intelligence across the enterprise, providing a single solution for alert detection, threat visibility, proactive hunting, and threat response.
Think of Microsoft Sentinel as the first SIEM-as-a-service that brings the power of the cloud and artificial intelligence to help security operations teams efficiently identify and stop cyber-attacks before they cause harm.
Microsoft Sentinel integrates with Microsoft 365 solution and correlates millions of signals from different products such as: - Azure Identity Protection, - Microsoft Cloud App Security, - and soon Azure Advanced Threat Protection, Windows Advanced Threat Protection, M365 Advanced Threat Protection, Intune, and Azure Information Protection.
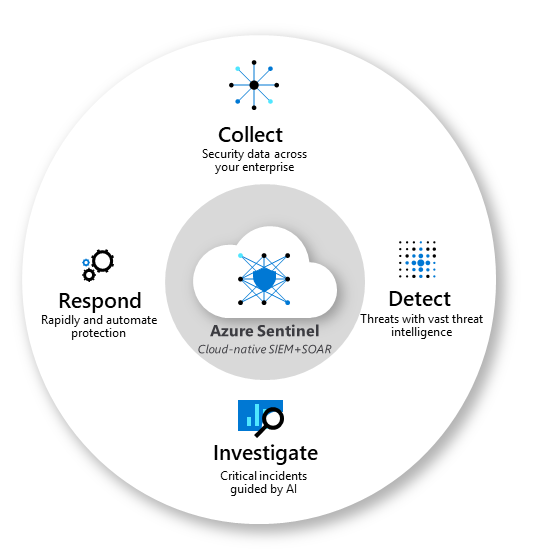
It enables the following services:
It enables the following services:
- Collect data at cloud scale across all users, devices, applications, and infrastructure, both on-premises and in multiple clouds.
- Detect previously undetected threats, and minimize false positives using Microsoft's analytics and unparalleled threat intelligence.
- Investigate threats with artificial intelligence, and hunt for suspicious activities at scale, tapping into years of cyber security work at Microsoft.
- Respond to incidents rapidly with built-in orchestration and automation of common tasks.
Configure data connections to Sentinel
To onboard Microsoft Sentinel, these are the global prerequisites:
- Active Azure Subscription
- Log Analytics workspace.
- To enable Microsoft Sentinel, you need contributor permissions to the subscription in which the Microsoft Sentinel workspace resides.
- To use Microsoft Sentinel, you need either contributor or reader permissions on the resource group that the workspace belongs to.
- Additional permissions may be needed to connect specific data sources.
- Microsoft Sentinel is a paid service.
Having those, to onboard Microsoft Sentinel, you first need to connect to your security sources.
Microsoft Sentinel comes with a number of connectors for Microsoft solutions, and additionally there are built-in connectors to the broader security ecosystem for non-Microsoft solutions. You can also use common event format, Syslog or REST-API to connect your data sources with Microsoft Sentinel as well.
The following data connection methods are supported by Microsoft Sentinel:
- Service to service integration: Some services are connected natively, such as AWS and Microsoft services, these services leverage the Azure foundation for out-of-the-box integration, the following solutions can be connected in a few clicks:
- Amazon Web Services - CloudTrail
- Azure Activity
- Microsoft Entra audit logs and sign-ins
- Microsoft Entra ID Protection
- Azure Advanced Threat Protection
- Azure Information Protection
- Microsoft Defender for Cloud
- Cloud App Security
- Domain name server
- Microsoft 365
- Microsoft Defender ATP
- Microsoft web application firewall
- Windows firewall
- Windows security events
External solutions
- API: Some data sources are connected using APIs that are provided by the connected data source. Typically, most security technologies provide a set of APIs through which event logs can be retrieved. The APIs connect to Microsoft Sentinel and gather specific data types and send them to Azure Log Analytics
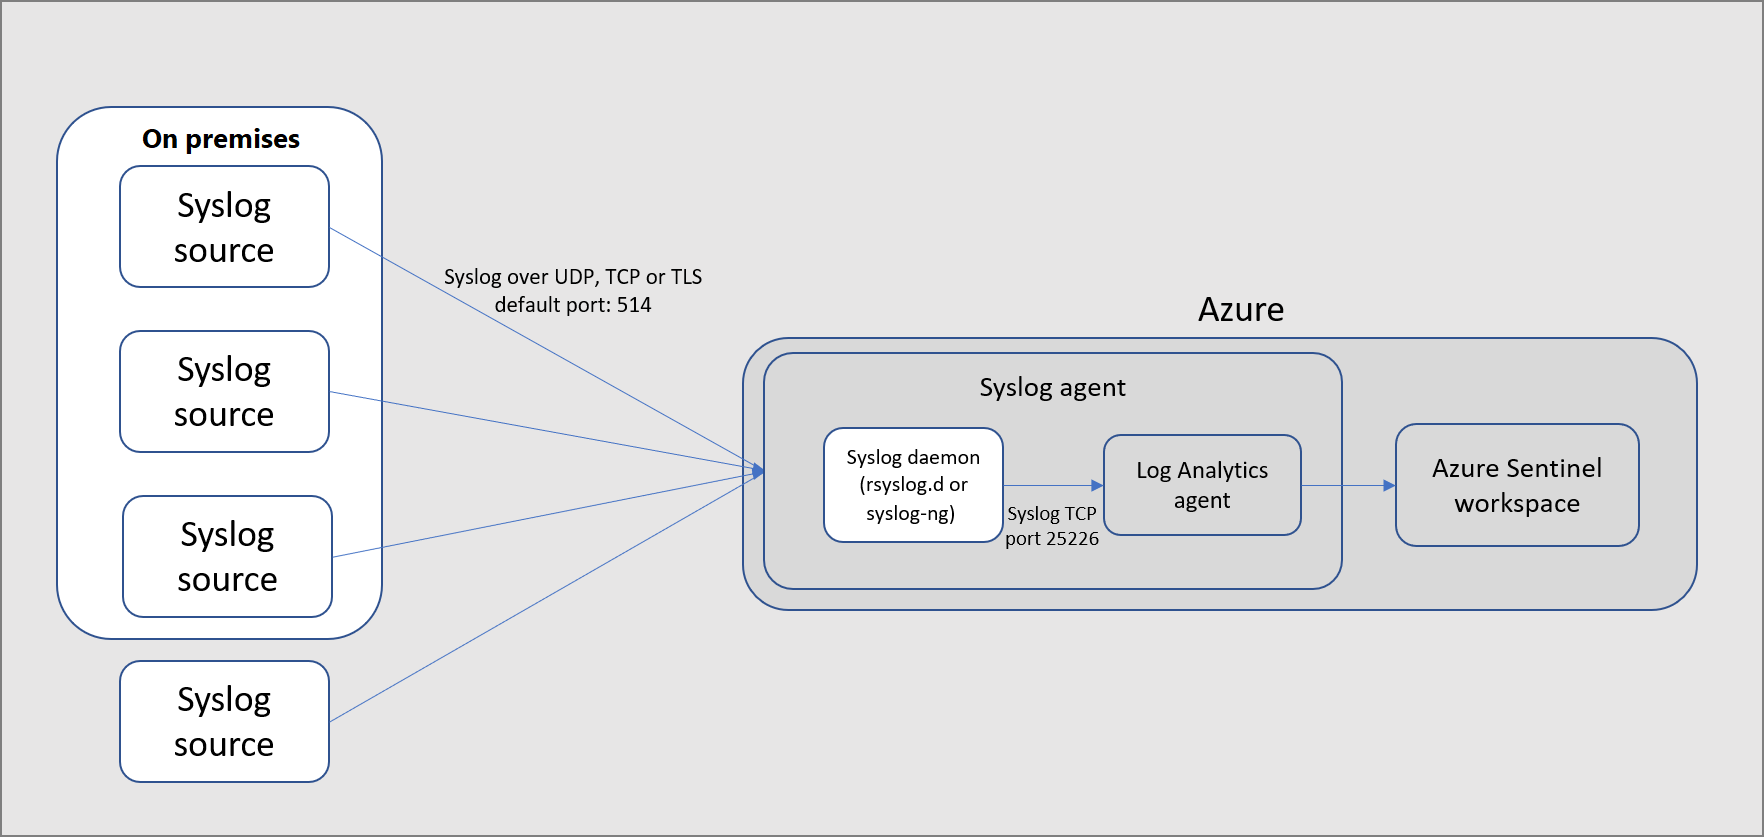
- Agent: The Microsoft Sentinel agent, which is based on the Log Analytics agent, converts CEF formatted logs into a format that can be ingested by Log Analytics. Depending on the appliance type, the agent is installed either directly on the appliance, or on a dedicated Linux server. To connect your external appliance to Microsoft Sentinel, the agent must be deployed on a dedicated machine (VM or on-premises) to support the communication between the appliance and Microsoft Sentinel. You can deploy the agent automatically or manually. Automatic deployment is only available if your dedicated machine is a new VM you are creating in Azure. Alternatively, you can deploy the agent manually on an existing Azure VM, on a VM in another cloud, or on an on-premises machine.
3.2. Create workbooks to monitor Sentinel data
After onboarding to Microsoft Sentinel, monitor your data using the Azure Monitor workbooks integration.
After you connect your data sources to Microsoft Sentinel, you can monitor the data using the Microsoft Sentinel integration with Azure Monitor Workbooks, which provides versatility in creating custom workbooks. While Workbooks are displayed differently in Microsoft Sentinel, it may be helpful for you to determine how to create interactive reports with Azure Monitor Workbooks. Microsoft Sentinel allows you to create custom workbooks across your data and comes with built-in workbook templates to quickly gain insights across your data as soon as you connect a data source.
Workbooks are intended for Security operations center (SOC) engineers and analysts of all tiers to visualize data. Workbooks are best used for high-level views of Microsoft Sentinel data and don't require coding knowledge.
You can't integrate workbooks with external data.
3.3. Enable rules to create incidents
To help you reduce noise and minimize the number of alerts you have to review and investigate, Microsoft Sentinel uses analytics to correlate alerts into incidents.
Incidents are groups of related alerts that indicate an actionable possible threat you can investigate and resolve.
You can use the built-in correlation rules as-is or as a starting point to build your own.
Microsoft Sentinel also provides machine learning rules to map your network behavior and then look for anomalies across your resources.
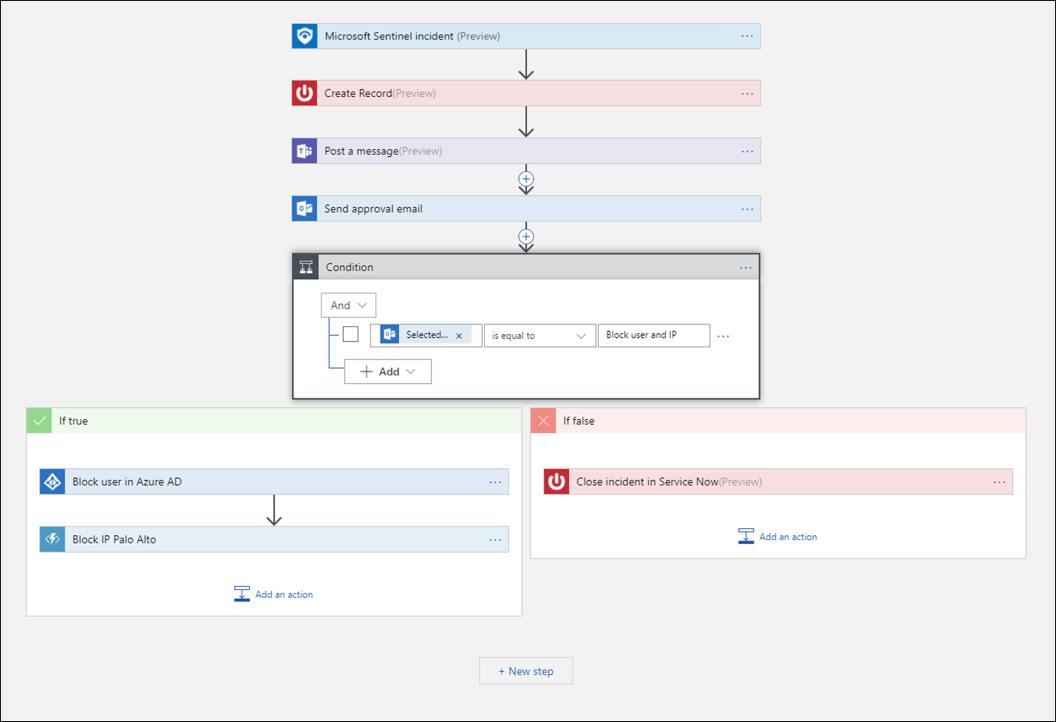
3.4. Configure playbooks
Automate your common tasks and simplify security orchestration with playbooks that integrate with Azure services and your existing tools.
To build playbooks with Azure Logic Apps, you can choose from a growing gallery of built-in playbooks. These include 200 or more connectors for services such as Azure functions. The connectors allow you to apply any custom logic in code like:
- ServiceNow
- Jira
- Zendesk
- HTTP requests
- Microsoft Teams
- Slack
- Microsoft Entra ID
- Microsoft Defender for Endpoint
- Microsoft Defender for Cloud Apps
For example, if you use the ServiceNow ticketing system, use Azure Logic Apps to automate your workflows and open a ticket in ServiceNow each time a particular alert or incident is generated.
Playbooks are intended for Security operations center (SOC) engineers and analysts of all tiers to automate and simplify tasks, including data ingestion, enrichment, investigation, and remediation. Playbooks work best with single, repeatable tasks and don't require coding knowledge. Playbooks aren't suitable for ad-hoc or complex task chains or for documenting and sharing evidence.
3.5. Hunt and investigate potential breaches
Microsoft Sentinel deep investigation tools help you to understand the scope and find the root cause of a potential security threat.
Interactive graph. - You can choose an entity on the interactive graph to ask interesting questions for a specific entity and drill down into that entity and its connections to get to the root cause of the threat.
Built-in queries. - Use Microsoft Sentinel's powerful hunting search-and-query tools, based on the MITRE framework, which enable you to proactively hunt for security threats across your organization’s data sources before an alert is triggered. While hunting, create bookmarks to return to interesting events later. Use a bookmark to share an event with others or group events with other correlating events to create a compelling incident for investigation.
Microsoft Sentinel supports Jupyter notebooks in Azure Machine Learning workspaces, including full machine learning, visualization, and data analysis libraries:
- Perform analytics that isn't built into Microsoft Sentinel, such as some Python machine learning features.
- Create data visualizations that aren't built into Microsoft Sentinel, such as custom timelines and process trees.
- Integrate data sources outside of Microsoft Sentinel, such as an on-premises data set.
Notebooks are intended for threat hunters or Tier 2-3 analysts, incident investigators, data scientists, and security researchers. They require a higher learning curve and coding knowledge. They have limited automation support.
Notebooks in Microsoft Sentinel provide:
- Queries to both Microsoft Sentinel and external data
- Features for data enrichment, investigation, visualization, hunting, machine learning, and big data analytics
Notebooks are best for:
- More complex chains of repeatable tasks
- Ad-hoc procedural controls
- Machine learning and custom analysis
Notebooks support rich Python libraries for manipulating and visualizing data. They're useful for documenting and sharing analysis evidence.
Last update: 2023-10-31 Created: October 31, 2023 18:01:17